The Benefits of Using Data Visualizations in Marketing
Hello!

Why Data Visualization Matters in Marketing
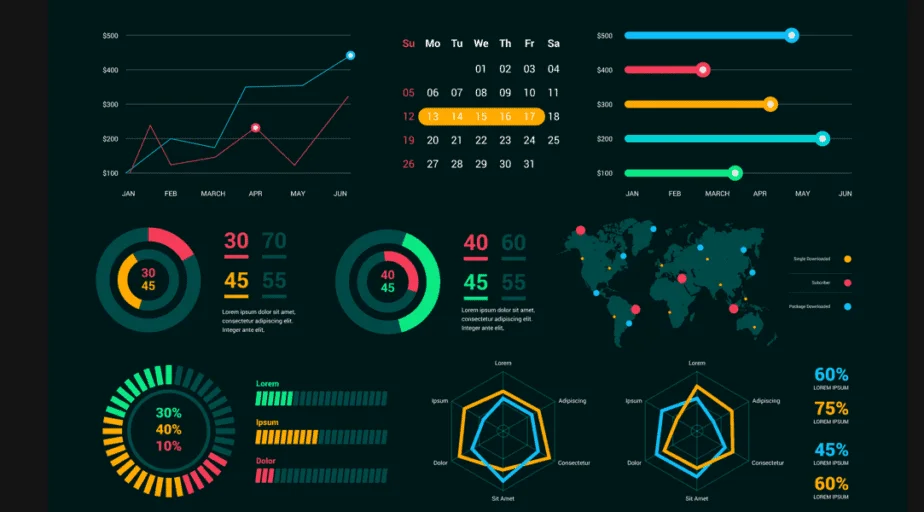
Marketers, creative professionals, and data enthusiasts all benefit from understanding the power of data visualization in their fields. Humans naturally respond to colors, shapes, and visual patterns, which makes information presented graphically far easier to process and remember.
Just as a compelling movie, advertisement, or painting holds attention through visuals, data presented visually improves both retention and comprehension. The same principle applies to charts and graphs: bar charts and pie charts instantly reveal proportions, trends, and outliers that might otherwise remain hidden in spreadsheets.
What Is Data Visualization?

Business intelligence relies heavily on these visual tools to turn raw numbers into actionable strategies. By translating data into clear visuals, companies can refine marketing approaches, optimize budgets, and identify new market opportunities with greater precision.


- Data collection through observation
- Completion of raw data gathering
- Outcome prediction based on sorted, visualized data
- Cross-department collaboration to address gaps
- Execution of decisions that pave the way for future initiatives
Data Design Fundamentals and Useful Tools
Modern platforms simplify the creation of effective visuals by offering ready-made templates and intelligent suggestions based on the dataset. Strong data design emphasizes clarity and minimalism, ensuring the message reaches the audience without unnecessary complexity.

Google Data Studio
This accessible Google-powered platform connects directly to multiple data sources, enabling users to build and share interactive dashboards in the cloud with professional templates.
Google Charts
Ideal for embedding dynamic, continuously updated visuals on websites, Google Charts works across major browsers and supports live data displays.
Tableau

Common Types of Data Visualization

- Infographics
- Tree maps, heat maps, and point-distribution maps
- Histograms
- Timelines
- Linear, pie, and bar charts
- Diagrams
- Maps
- Dashboards
- Scatter plots, area charts, bullet charts, Gantt charts, and flow charts
- Bubble clouds, matrices, and networks
Benefits of Data Visualization for Marketing

- Unlocks insights from large datasets
- Reveals patterns that would otherwise stay hidden
- Organizes information according to campaign needs
- Improves information absorption
- Speeds up decision-making
- Saves time for teams and executives
- Highlights profit and loss drivers
- Shows relationships between operations and results
- Flags anomalies in marketing strategies
- Encourages data-driven conversations across the organization
- Defines and tracks KPIs effectively
Practical Applications

Automated data pipelines further accelerate reporting by pulling information from multiple sources into clean, visual formats—reducing reaction time to market shifts.
Companies often rely on data specialists to explore long-term opportunities through these visual tools. It is clear that data visualization opens new pathways for refining marketing and business activities.
Also read: Gemini Robotics: Pioneering On-Device AI for Autonomous Robots
Conclusion

Each metric offers unique value; selecting the right combination amplifies impact. Organizations that invest in strong visualization practices continue to see measurable returns over time.
Thank you!
Subscribe to our newsletter! Join us on social networks!
See you!
Subscribe to our newsletter
Get the latest Web3, AI, and crypto news delivered straight to your inbox.