Top 7 Benefits of Data Visualization for Your Small Business
Hello!
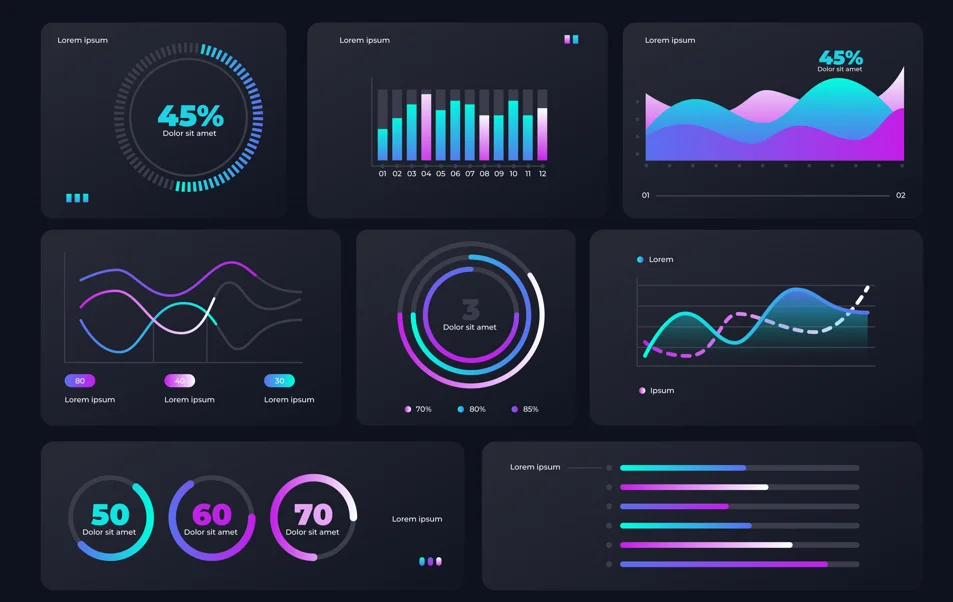
There is a lot to be done with a lot of data. Data visualization can be a powerful tool to present your data and also interpret it and analyze it. Data visualization can bring small businesses many benefits.

That being said, 97.2% of organizations around the globe are already investing in big data and artificial intelligence. If you don’t have a data-first strategy in place, you should.
However, a lot of data can also mean a lot of responsibility. Data visualization can be a powerful tool to present your data and also interpret it and analyze it. Data visualization can bring small businesses many benefits.
Top 7 Benefits of Data Visualization for Your Small Business
#1: Data Management

Data visualization can help your business organize and present all necessary data in an easily accessible manner. It can be easier to combine a lot of data into one graph and store it than trying to fill your servers and sheets with redundant data you may not use.
#2: Present Forecasts Work More Effectively
External or internal presentations can be stressful. Forecasts that require lengthy calculations and formulas are especially stressful.
Although it is difficult to ignore the work involved in collecting and calculating forecasts, it is worth exploring other ways to present these data. Data visualization can be a great tool for businesses to present their forecast reports in a more readable and concise manner. Businesses can easily break down complex data, and there is an undisputed aesthetic advantage.
Bright colors and patterns can make important data stand out and grab attention instantly through data visualization. Bold colors can be used to highlight the metrics you wish to attract the most attention in your next forecast meeting.
#3: An Easy Analysis of Reports

No matter if the report is for sales, marketing, or accounting, it can provide a lot of insights and data about various areas. It can be difficult to combine all of this data and make an impact. Data visualization makes it simpler by helping to highlight the areas that require improvement and the most profitable metrics.
Companies can quickly analyze reports and take corrective action by having the data they need in an easily accessible format. This is especially important when it comes time to analyze risk management reports within organizations.
#4: Boosts Online Visibility

It can be difficult to rank organically in a highly competitive market if you have text-only content. However, capitalizing on data-driven images to build a reputation can be a great way to approach content marketing for your SaaS company.
Plus, did you know that 20% of all Google searches take place on Google Images?
SEO experts will tell you that optimizing images for SEO is a worthwhile investment that will pay off in faster rankings. Consider creating infographics for data and stats-rich blogs and optimizing them for SEO.
#5: Enhances Decision-Making Process
Better data representations and reports can lead to better decision-making processes. The process can be made faster and the quality of decisions can be significantly improved.

It is also important to remember that data visualization can facilitate smoother data transfer from one party to the other, which in turn allows for better decision-making.
#6: Motivates Higher Engagement
It is the quality of content that matters regardless of format. This is not true. A study by Nucleus Research suggests that when you disseminate data with visualizations, they can offer an ROI of nearly $13 for every dollar spent.
It is due to greater engagement, which then leads to actions much more quickly than plain text. The use of graphs or charts within your content can increase interest. They are easier to understand, more appealing to the eye, and provide more context than text.
#7: Establishes Data Relationships Easily

If the same data is presented visually, however, many people will be better able to recognize and understand the relationships among various parameters. Managers and teams would be able also to see patterns in the data.
These visual representations and insights are useful for making better decisions and saving time for those who interpret the data.
Also read:
- The Technology Behind Medical
- New Marketplaces Added to QUASA NFT
- HIV Vaccine Now Available in the USA: Yeztugo Offers Groundbreaking Protection
Conclusion
Companies need to be able to understand large data sets better thanks to big data technologies. Visualization is a great way to manage and segregate data.
Data visualization can provide powerful insights and a simple way to identify patterns. It can also help in decision-making and user engagement. Get started now with data visualization in your business.
Thank you!
Subscribe to our newsletter! Join us on social networks!
See you!
Subscribe to our newsletter
Get the latest Web3, AI, and crypto news delivered straight to your inbox.