7 Business Intelligence Tools Every Enterprise Must Use
Hello!
A Business Intelligence platform, also known as a management solution, is a software application that receives and analyzes large amounts of data from various business sources such as journals, documents, files, metadata, emails, photos, videos, and more.
While these tools are not as flexible as full-scale Business Intelligence platforms, they do provide several methods for handling data to obtain insights via queries. Furthermore, they enable BI professionals to prepare information before evaluating it to create dashboards, reports, and visual representations.

This results in an outcome that gives all employees in the organization the ability to make informed decisions, identify upcoming revenue streams, define the latest opportunities for growth, boost operational efficiency, understand market dynamics, and more.
Now let us examine why these techniques are required, and then we will look at the multiple business reporting tools.
Why BI Tools Are Important in 2026
BI tools have traditionally been used for querying and transforming company records, but they also combine a diverse range of processes for statistical analysis. Enterprise reporting, embedded BI, mobile BI, online analytical processing (OLAP), organizational BI, open-source BI, ad hoc analysis, and other applications may be included.

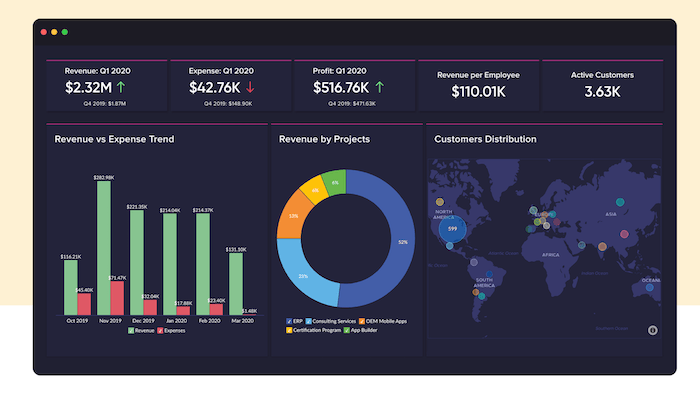
Furthermore, they include data visualization applications that enable different charts and graphs to create high-quality benchmarks and dashboards that display KPIs and key metrics. These visualization tools help practitioners bring relevant information to life and make sense of it.
Here is a summary of the most popular BI tool examples that are used regularly across a variety of organizational operations.
7 Business Intelligence Tools Every Enterprise Must Use
Tableau
Tableau is among the most famous and user-friendly business intelligence platforms in use today. It ranks high on the best BI tools list. With this integrated tool, many non-technical users can access personalized dashboards and reports to obtain crucial data.
It offers a diverse range of immersive and interactive data visualizations. The tool primarily serves two purposes: data gathering and statistical analysis. It collects information from a variety of sources, including documents and cloud computing platforms. This data analysis technology is used in a variety of industry sectors such as financial services, manufacturing, and education.
Features Include:

Dashboards and tools for performing target market analysis on any given dataset can be shared. You can choose from two versions: the 32-bit version and the 64-bit version. It features a fast data update capability that helps users obtain the most up-to-date data and derive insights in real time. The solution can be installed on a local machine or in the cloud.
Sisense
The primary goal of the BI tool Sisense is to collect, evaluate, and visualize datasets of any size. It is among the most commonly used dashboard BI tools, with an adaptive interface that provides an intuitive drag-and-drop functionality, enabling anyone — including those without an IT background — to use and understand it.
In Sisense, users record and analyze data in a centralized repository for mapping and monitoring. They can also use the software’s numerous visualization and analysis tools to create dashboards. Users can share dashboards and reports with team members, other departments, and external audiences. This enables businesses to analyze various issues and develop accurate growth strategies.
QlikView
QlikView is a popular business intelligence tool that makes it possible to create apps, dashboards, and visualizations. It offers a detailed overview of the data held in your systems. Its simple drag-and-drop feature helps create immersive and highly customizable visualizations. Natural language queries can be used to explore and connect large amounts of information. It responds quickly to queries, alerts, and interactions, and accepts a variety of file formats and data sources.
Looker

Looker is a business intelligence application suitable for startups and small and medium-sized businesses. It integrates with nearly every database system or data warehouse, such as Redshift, Snowflake, and BigQuery, and is simple to use. The platform includes powerful additional capabilities that allow users to connect predictive analytics and share reports via email or third-party applications. Customers can implement a multi-cloud strategy with various sources and deployment methods.
Looker gives data experts the ability to view each customer across all touchpoints, enabling them to uncover additional insights based on current interactions. It is an excellent method for understanding consumer behavior, developing tailored messaging, and identifying promotional opportunities to enhance operational efficiency.
Datapine
Datapine is a business intelligence tool for companies of all sizes across a wide range of industries. It is suitable for both advanced and mid-level corporate users. The platform allows users to subscribe to data from multiple sources, analyze it, create dashboards, and generate reports. Datapine includes a SQL editor that enables users to create custom queries, as well as a drag-and-drop interface that allows business users to build visualizations without sophisticated coding.
The platform also includes analytics capabilities such as predictive modeling based on a forecasting engine. Users can select KPIs, choose the datasets they want to predict, specify prior datasets, and evaluate model performance by setting a standard deviation.
Microsoft Power BI

Microsoft Power BI is a business intelligence suite focused on data visualizations that can be used across organizations. It is designed for corporate environments but allows users at all levels to make informed decisions. Microsoft Power BI provides the flexibility to incorporate a variety of third-party applications. Users can attach Excel queries, data structures, and reports to their dashboards to collect, analyze, and share business information.
The platform integrates seamlessly with Azure cloud services, allowing users to easily share large amounts of information with relevant stakeholders. It also improves teamwork and reduces the time required to obtain insights.
Domo BI Tool
Domo is a cloud-based business intelligence product that consists of various systems allowing users to connect to multiple sources (including databases, spreadsheets, and social media) and extend them with pre-built applications from the Domo Appstore. The tool was developed for enterprise customers but can also be used by small companies with innovative data teams.
Domo enables customers to create data products using 1,000+ pre-built visualization adapters and requests. Supported sources include file uploads (such as Google Docs or spreadsheets), proprietary information, and on-premise use of Domo Workstation.

The platform includes Magic ETL, which allows users to perform data transformations without knowing SQL. This helps managers accelerate analytics procedures. Domo also provides instant visualization tools, enabling teams to quickly move from raw data sources to charts, graphs, and layouts.
Mr. Roboto, Domo’s built-in AI engine, assists data teams in creating intelligent detection designs and enables the use of machine learning and artificial intelligence. Users can configure it to notify them whenever KPIs change.
Conclusion
Decision-makers, data teams, and stakeholders can use BI insights to comprehend large volumes of business information, evaluate it, and make rapid and profitable strategic decisions. Modern self-service BI systems make it simple for almost anyone on a team to communicate and distribute data visualizations and gain knowledge faster without coding.
Thank you!
Join us on social media!
See you!
Subscribe to our newsletter
Get the latest Web3, AI, and crypto news delivered straight to your inbox.